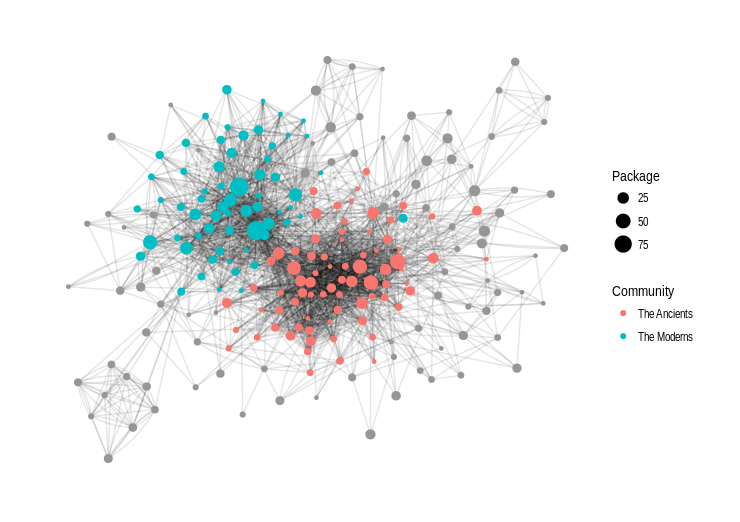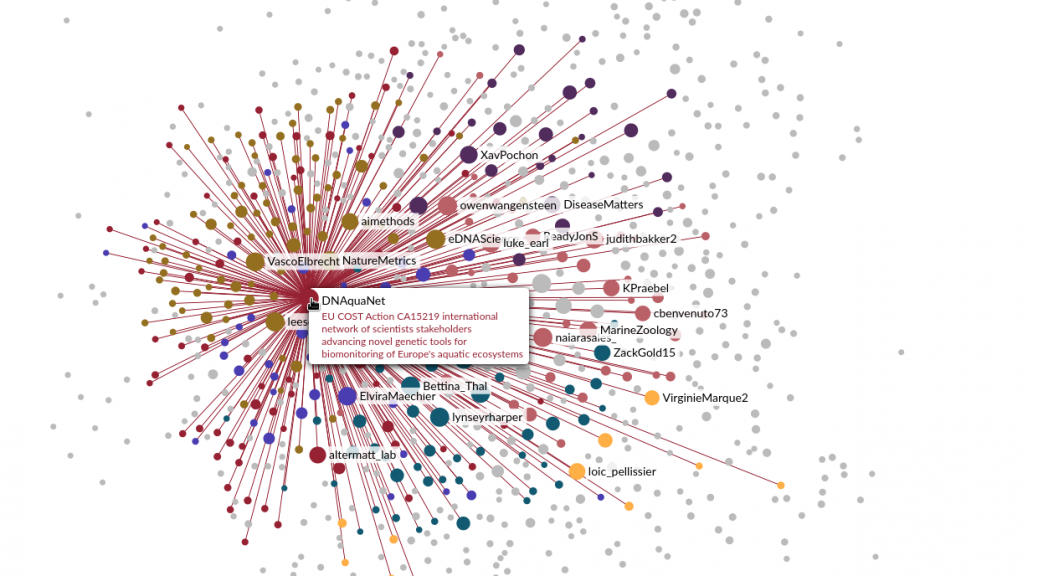
A cartography of the eDNA community on Twitter
I recently published on Twitter the result of some experiments to represent the community of users working on the topic of environmental DNA and metabarcoding. These tweets were quite successful, so I’m writing this quick post to keep a trace of them, and expand a bit the story behind. I had been thinking for some time now about using Twitter data to model this community, probably inspired by projects I saw here and there, and by all the interactions I…