Rummaging through dusty books: Maucha diagrams in R
Do you know the Maucha diagram? If you are not an Hungarian limnologist, probably not! This diagram was proposed by Rezso Maucha in 1932 as a way to vizualise the relative ionic composition of water samples. However, as far I know this diagram had few success in the community. I never heard about it until my coworker Kalman (who is also Hungarian) asked me if I knew how to plot it in R.
First, I have to admit I was a bit skeptical… But finally, we decided it could be an interesting and funny programming exercise.
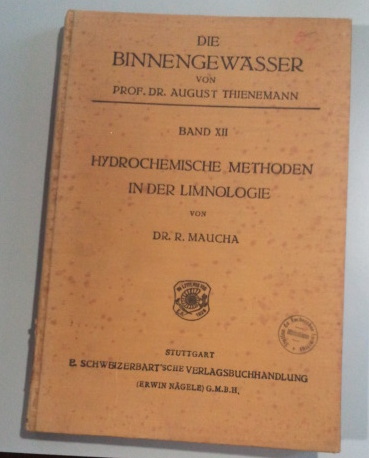
We found instructions to draw the diagram in Broch and Yake (1969) [1] but rapidly we were interested to find the original paper of Maucha [2]. This paper is apparently not available on-line, and we could only find a hard copy in the University of Grenoble (2 hours driving). Nonetheless, we had a look in the library of the lab and… miracle! We found it, between two old dusty books, probably waiting for decades!
Meticulously following the instructions of Maucha, we could write a function to draw the diagram. Then we added some additional options : colors, labels and the possibility to draw multiple diagrams from a matrix. Finally we put the code in a package (hosted on Github) with the dataset included in the original publication.
To install the package, install devtools from your CRAN repo and run:
devtools::install_github("fkeck/oviz")
Then you can load the dataset used by Maucha [2] to introduce his diagram:
data(ionwaters)
And then you can use the function maucha which will plot one diagram for each line of the matrix.
maucha(ionwaters)
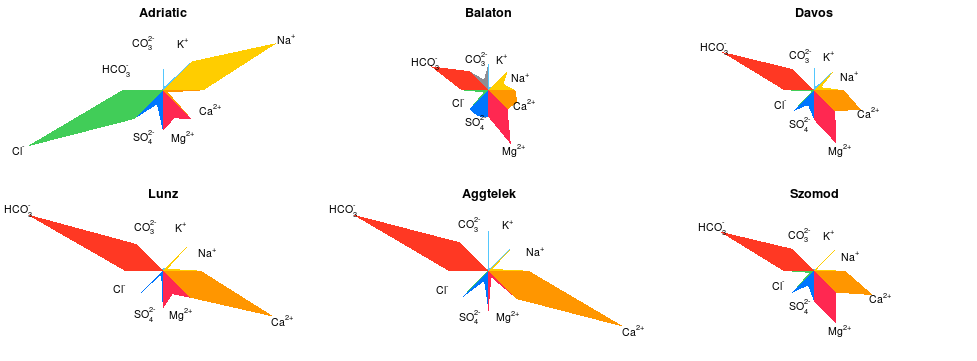
Here we are. And if you are interested in ionic composition of waters, stay tuned, we are planning to add some stuff like stiff diagram and piper diagram.
[1] Broch, E. S., & Yake, W. (1969). A modification of Maucha’s ionic diagram to include ionic concentrations. Limnology and Oceanography, 14(6), 933-935.
[2] Maucha, R. (1932). Hydrochemische Methoden in der Limnologie. Binnengewasser, 12. 173p.
7 réactions au sujet de « Rummaging through dusty books: Maucha diagrams in R »
I saw this on R-Bloggers and wanted to say what a great little project. Nice output too. It doesn’t mean much to me, as it’s not my field, but this is exactly the type of thing I love about R – define a goal, research, write some code, create a package and share!
Thank you.
This is also what I love. Because long term and big projects can become very boring, this kind of little stories brings some fun 😉
Looks nice, but how about sharing some information on how to interpret them? 😉
Cheers,
Andrej
Hi! Thank you for your feedback. I will edit with some comments to interpret.
Great job! I have been looking for a way to plot Piper diagrams in R with ggplot2, but so far I only found http://www.ggtern.com/. Please consider using ggplot2 for your stiff and piper diagram functions! Would be awesome!
Thank you for an impressive post (a bit late, I know, but I only saw it today), as I have been drawing Maucha diagrams for years, with various programs, starting with Pascal in the 1980s, then Arc/Info, ArcView, ArcGIS, Excel (e.g. http://www.riv.co.za/wv/ and http://www.dwa.gov.za/iwqs/water_quality/NCMP/nwrqsr.aspx). While trying to figure out how to draw the Maucha symbol using R in 2010, I had some unexpected but very welcome assistance from a PhD student in Canada, who asked me to debug her R script. It was a very minor error and finding a solution helped me to understand a great deal about R graphics… And to draw thousands of Maucha diagrams for mapping water quality in South Africa. So much more efficient than ArcGIS.
The famous book of Rezso Maucha is impossible to find here, and I was very privileged to meet one of his grandchildren on the Internet, who kindly made me a photocopy of the relevant pages. Your photo of the cover page is the first that I have seen of the actual book.
Dear Mike,
Thank you for your enthusiastic and interesting message. While we were looking for informations on Internet we found many documents from you and about your work in South Africa. So, I’m very happy you found this post and liked it. About the book, we were actually very surprised to find it in the very small library of our lab.