The Mathematics Genealogy Project: Customizing my mathematical family tree
Some time ago, Maëlle Salmon published a very nice post showing how she scraped her mathematical family tree from the Mathematics Genealogy Project. Of course I immediately wanted to produce my own! I am not a mathematician myself, but one of my PhD supervisor has a PhD in mathematics. Which makes me the indirect descendant of a long lineage of famous mathematicians! As Maëlle kindly invited me to share my tree on Twitter, I decided to write this post to show how I customized the appearance of my tree to make it more sexy. [It is actually part of my job to plot sexy phylogenetic tree…]. So, this post is a remix of Maëlle’s post which was a remix of Nathalie Vialaneix’s post 🙂
1. Scraping more data
First I modified a bit Maëlle’s scraping function to collect more data. I added Xpath selectors for the degree, the university, the country, the year and the title of the thesis. I am not going to use all these informations but now they are here if you need them.
library(magrittr)
library(DiagrammeR)
library(dplyr)
library(igraph)
library(purrr)
library(stringr)
library(rvest)
library(xml2)


.get_advisors <- function(id_string = "id.php?id=143630", sleep_time, terminal = FALSE){
  # small break to be nice
  Sys.sleep(sleep_time)

  # try to get the page
  page <- glue::glue("https://www.genealogy.math.ndsu.nodak.edu/{id_string}") %>%
    httr::GET()

  # try until it works but not more than 5 times
  try <- 1
  while(httr::status_code(page) != 200 & try <= 5){
    Sys.sleep(sleep_time)
    page <- glue::glue("https://www.genealogy.math.ndsu.nodak.edu/{id_string}") %>%
      httr::GET()
    try = try + 1
  }

  # Now get student's data
  student_name <- httr::content(page) %>%
    rvest::xml_nodes(xpath = '//h2[@style="text-align: center; margin-bottom: 0.5ex; margin-top: 1ex"]') %>%
    rvest::html_text() %>%
    stringr::str_remove("\\\n")

  degree <- httr::content(page) %>%
    rvest::xml_nodes(xpath = '//span[@style="margin-right: 0.5em"]/span/preceding-sibling::text()') %>%
    rvest::html_text()

  university <- httr::content(page) %>%
    rvest::xml_nodes(xpath = '//span[@style="margin-right: 0.5em"]/span') %>%
    rvest::html_text()

  year <- httr::content(page) %>%
    rvest::xml_nodes(xpath = '//span[@style="margin-right: 0.5em"]/span/following-sibling::text()') %>%
    rvest::html_text() %>%
    stringr::str_trim()

  country <- httr::content(page) %>%
    rvest::xml_nodes(xpath = '//div[@style="line-height: 30px; text-align: center; margin-bottom: 1ex"]/img') %>%
    rvest::html_attr("title")

  thesis_title <- httr::content(page) %>%
    rvest::xml_nodes(xpath = '//span[@id="thesisTitle"]') %>%
    rvest::html_text() %>%
    stringr::str_remove_all("\\\n")

  # Get all nodes corresponding to advisors
  # Thanks to their... formatting but it works
  all_advisors <- httr::content(page) %>%
    rvest::xml_nodes(xpath = "//p[@style='text-align: center; line-height: 2.75ex']") %>%
    rvest::html_nodes("a")

  if(terminal){
    name <- NA
    id_string_advisors <- NA
  } else {
    name <- purrr::map_chr(all_advisors, rvest::html_text)
    id_string_advisors <- purrr::map_chr(all_advisors, rvest::html_attr,
                                         "href")
  }

  # Export results
  tibble::tibble(student_name = student_name,
                 degree = list(degree),
                 university = list(university),
                 year = list(year),
                 country = list(country),
                 thesis_title = list(thesis_title),
                 id_string_student = id_string,
                 name = name,
                 id_string = id_string_advisors)
}

get_advisors <- memoise::memoise(.get_advisors)


#### Download and prepare data ####
# initial data.frame
df <- get_advisors(me, 5)
new_df <- df
keep_growing <- TRUE

while(keep_growing){
  # get size to compare to size after a bit more scraping
  nrow1 <- nrow(df)
  # get advisors for all new lines
  # from the previous iterations
  new_df <- purrr::map_df(new_df$id_string, get_advisors, sleep_time = 30)
  df <- unique(rbind(df, new_df))
  # if the data.frame didn't grow, stop
  if(nrow(df) == nrow1){
    keep_growing <- FALSE
  }
}


df <- df %>% mutate(student_name = stringr::str_trim(student_name),
                    name = stringr::str_trim(name))


terminal_df <- setdiff(df$id_string, df$id_string_student) %>%
  map(get_advisors, terminal = TRUE, sleep_time = 30) %>%
  bind_rows() %>%
  mutate(student_name = stringr::str_trim(student_name),
         name = stringr::str_trim(name))
2. Labels
I wanted to create labels with the name of the mathematician, the flag of the country and the year. Displaying a picture in a node with graphviz (using DiagrammeR) was not simple. Apparently it is possible to use some kind of basic HTML to format nodes but I failed to include images. Finally I decided to use emojis 🙂 Thanks to Hadley Wickham’s package emo it was fairly easy.
#### Construct the graph ####
# create nodes
labels <-  unique(c(df$student_name, df$name))
nodes_df <- create_node_df(n = length(labels))
nodes_df$label <- labels

df_red <- df %>%
  bind_rows(terminal_df) %>%
  filter(!duplicated(student_name)) %>%
  right_join(nodes_df, by = c("student_name" = "label"))


# create edges
edges_df <- df[, c("name", "student_name")]
edges_df <- dplyr::left_join(edges_df, nodes_df,
                             by = c("name" = "label"))
edges_df <- dplyr::rename(edges_df, from = id)
edges_df <- dplyr::left_join(edges_df, nodes_df,
                             by = c("student_name" = "label"))
edges_df <- dplyr::rename(edges_df, to = id)

edges_df <- mutate(edges_df, rel = "a", color = "BurlyWood4")


# Create labels
years <- map_chr(df_red$year, paste, collapse = " ") %>%
  map_chr(str_trim) %>%
  str_replace_all("(?<=[0-9]{4}) (?=[0-9]{4})", ", ") %>%
  str_replace_all(" /", ", ") %>%
  paste0("(", ., ")") %>%
  str_replace_all("\\(\\)", "")


df_red$country <-
  map_if(df_red$country,
         (map_lgl(df_red$country,~ is.null(.x)) | map_lgl(df_red$country,~ length(.x) == 0)),
         function(x) "") %>%
  map(stringr::str_replace, "UnitedKingdom", "United Kingdom")

country_flag <- map_if(df_red$country,
                       map_lgl(df_red$country,~ any(!.x == "")),
                       function(x) map_chr(x, ~ as.character(emo::flag(paste0("^", .x, "$"))))) %>%
  map_chr(paste, collapse = " ⋅ ")


label <- paste0(nodes_df$label, "\n", years, "")
label <- paste0(nodes_df$label, "\n", country_flag, "\n", years, "")

nodes_df$label <- label %>%
  str_replace_all("'", " ") %>%
  str_replace_all("[[:space:]]{2,}", " ")
3. Adding my self
nodes_df <- bind_rows(nodes_df,
              tibble(id = nrow(nodes_df) + 1,
                type = NA, label = "François Keck\n🇫🇷\n(2016)"))

edges_df <- bind_rows(edges_df,
              tibble(name = "AF", student_name = "FK",
                 from = 1, type.x = NA,
                 to = nrow(nodes_df), type.y = NA,
                 rel = "a", color = "BurlyWood4"))
4. Customizing the style of the nodes
I changed the color and shape of the nodes. For some obscure reasons the rectangle-based shapes of graphiz are not correctly rendered in Firefox on Ubuntu (labels are overlapping). It worked on Windows but then I couldn’t display my flags with colored emojis 🙁 The only solution I found was to fix the font size manually (see next point).
# Customizing the nodes
nodes_df <- mutate(nodes_df,
                   shape = "note",
                   color = "Tan",
                   fillcolor = "Moccasin",
                   style = "filled")


# create a DiagrammeR dgr_graph object
dgr <- create_graph(nodes_df = nodes_df,
                    edges_df = edges_df[, c(-1, -2)],
                    directed = TRUE)

# export the object to igraph format
# and then write it to a GraphViz DOT file
DiagrammeR::to_igraph(dgr) %>%
  igraph::write.graph(file = "graph.dot",
                      format = "dot")
DiagrammeR::grViz("graph.dot", width = 4000, height = 5000)
5. The final touch
The viz.js library which stands behind DiagrammeR renders DOT objects in the browser via SVG. SVG files are XML-based and therefore can be directly processed with R. This gives us great power to manipulate the look of our tree.
First, we need to convert the widget to static HTML/SVG. We can do that in command line using Chromium in headerless mode to render the widget page.
DiagrammeR::grViz("graph.dot", width = 4000, height = 5000) %>%
  htmlwidgets::saveWidget("index.html")
system("chromium-browser --headless --dump-dom index.html > genealogy.html")
Finally, I used R and xml2 to edit directly the SVG content and improve the look of the tree. In the code below I show how to fill the page and labels backgrounds with a texture image, how to fix the text size, and how to add a shadow effect on labels.
# Load and clean html
html <- read_html("index.html")

xml_find_all(html, '//script') %>%
  xml_remove()

# Background
xml_find_all(html, '/html/body') %>%
  xml_set_attr('style', 'background-image: url("ricepaper2.png"); margin: 0px; padding: 40px;')

xml_find_all(html, '/html/body/div/div/svg/g/polygon') %>%
  xml_set_attr('fill', 'transparent')


# Labels text size
xml_find_all(html, '//text') %>%
  xml_text() %>%
  str_detect("(^[A-Z])|(^\\()") %>%
  extract(xml_find_all(html, '//text'), .) %>%
  xml_set_attr('font-size', '12')


# Labels background
xnodes <- xml_find_all(html, '//polygon[@fill="#ffe4b5"]')
xml_set_attr(xnodes, 'id', 'paper_tag')
xml_set_attr(xnodes, 'fill', 'url(#img1)')

xml_find_all(html, '/html/body/div/div/svg') %>%
  xml_add_child(read_xml('
  <defs>
    <pattern id="img1" patternUnits="userSpaceOnUse" width="100" height="100">
      <image href="beige_paper2.png" x="0" y="0" width="100" height="100" />
    </pattern>
  </defs>'), .where = 0)


# Labels shadow fx
xml_find_all(html, '//polygon[@id="paper_tag"]') %>%
  xml_set_attr('filter', 'url(#f3)')

xnodes <- xml_find_all(html, '//*[@stroke="#d2b48c"]')
  xml_set_attr(xnodes, 'stroke', '#000000')
  xml_set_attr(xnodes, 'stroke-width', '0.5')

xml_find_all(html, '/html/body/div/div/svg') %>%
  xml_add_child(read_xml('
  <defs>
    <filter id="f3" x="-10%" y="-10%" width="200%" height="200%">
      <feOffset result="offOut" in="SourceAlpha" dx="1" dy="1" />
      <feGaussianBlur result="blurOut" in="offOut" stdDeviation="2" />
      <feBlend in="SourceGraphic" in2="blurOut" mode="normal" />
    </filter>
  </defs>'), .where = 0)

write_html(html, "genealogy.html")
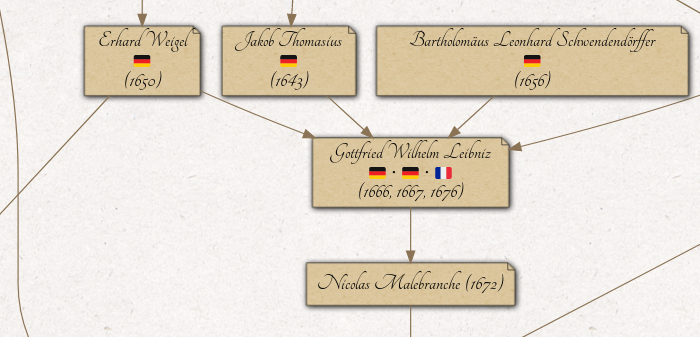
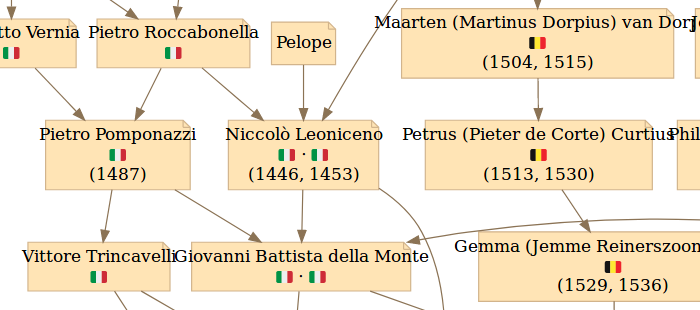
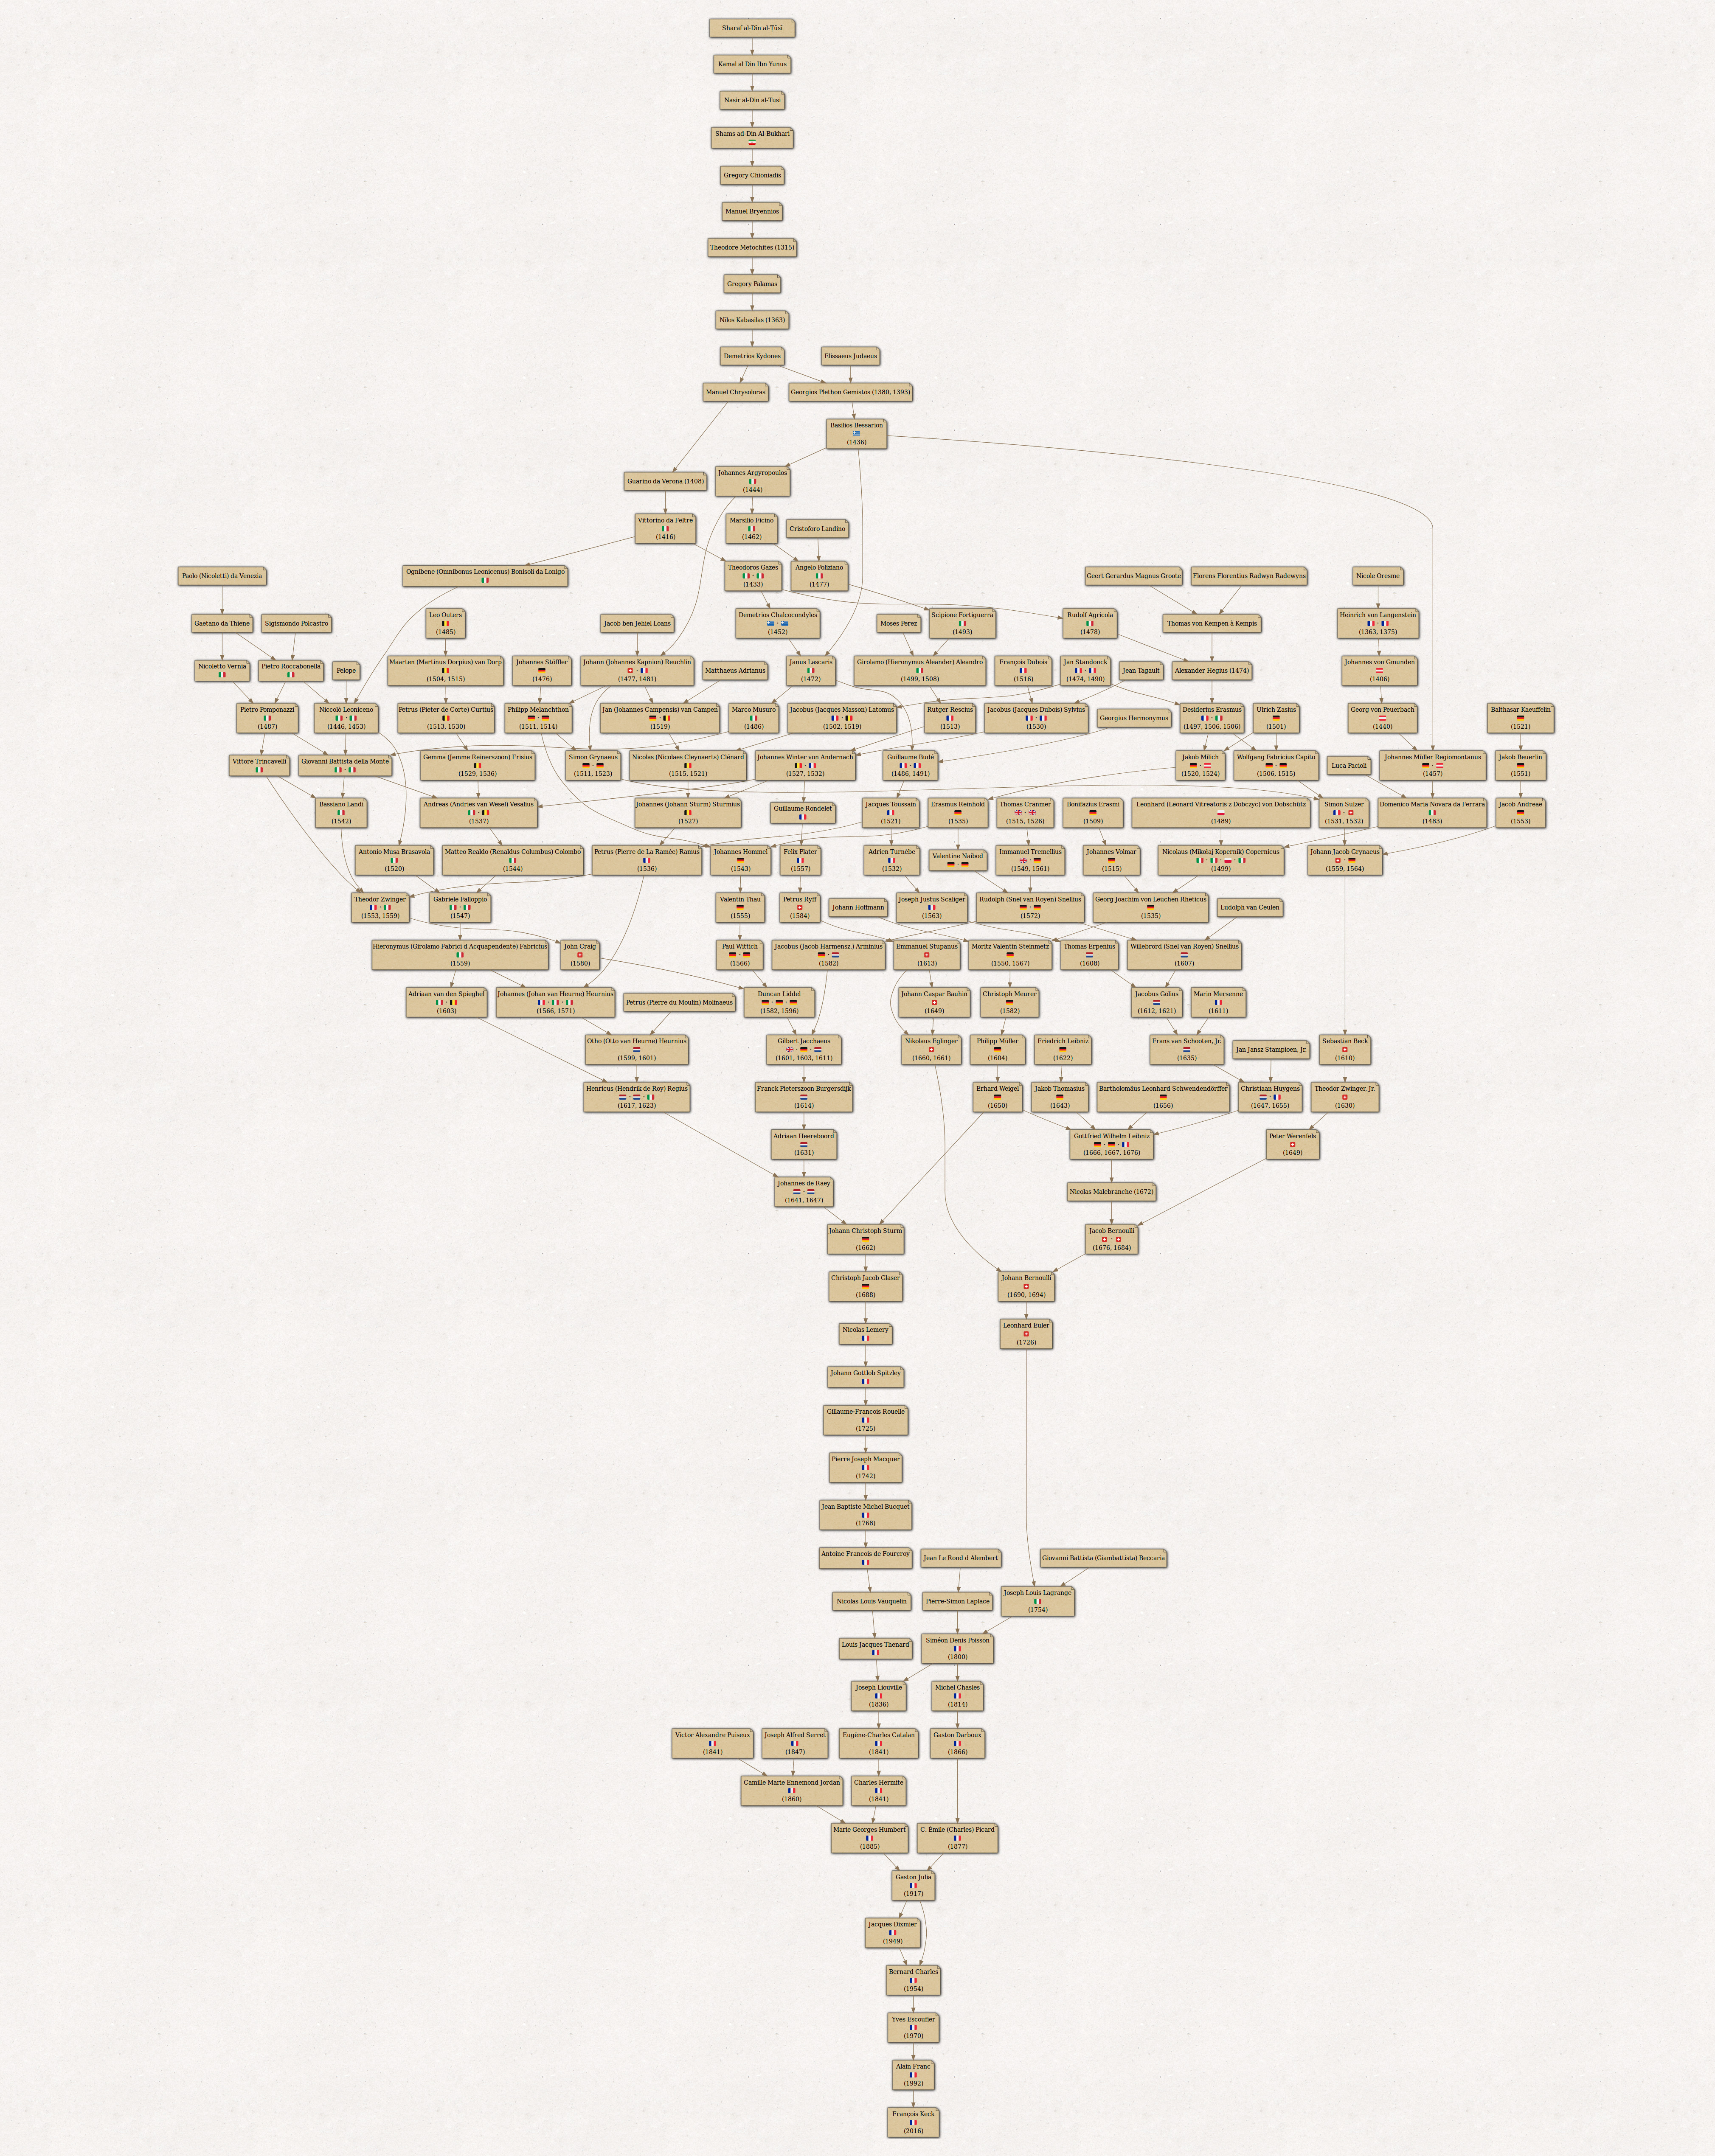
I find the result pretty nice 🙂
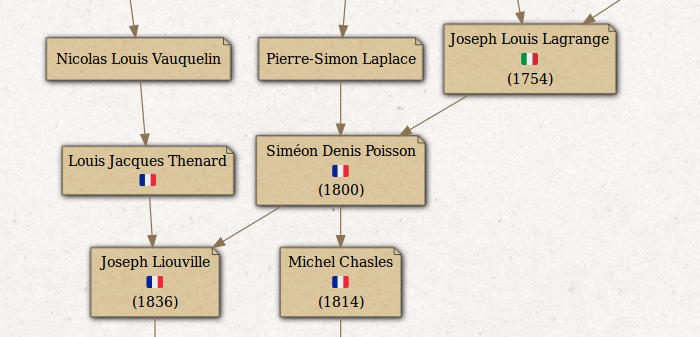
And this is my mathematical family tree! I recognize some illustrious names here! Do you?
Bonus:
For a better parchment look, we can use the calligraphic font Tangerine for the labels. Note that some glyphs are unfortunately not supported by this font.
# Labels font.
xml_find_all(html, '//text') %>%
  xml_text() %>%
  str_detect("(^[A-Z])|(^\\()") %>%
  extract(xml_find_all(html, '//text'), .) %>%
  xml_set_attr('font-size', '20')

xml_find_all(html, '//text') %>%
  xml_text() %>%
  str_detect("(^[A-Z])|(^\\()") %>%
  extract(xml_find_all(html, '//text'), .) %>%
  xml_set_attr('font-family', 'Tangerine')

xml_find_all(html, '/html/head') %>%
  xml_add_child(read_xml('<link rel="stylesheet" href="https://fonts.googleapis.com/css?family=Tangerine"/>'))
Une réaction au sujet de « The Mathematics Genealogy Project: Customizing my mathematical family tree »
C’est MAGNIFIQUE ! Bravo !